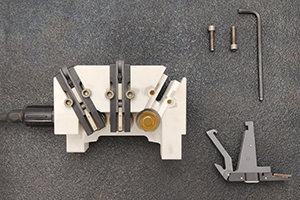
Unlike analog auxiliary sensors, instruments that output serial RS-232 data are more challenging to integrate with Sea-Bird Scientific CTDs. Despite RS-232 being a standard communication protocol, most instruments have a unique data output format and command set. As...
Platform
Q&A: Temperature Mismatch
Although they should match perfectly, the two sensors rarely reported the same temperature value throughout their deployment. Furthermore, the 16plusV2 appeared to stop logging, although the batteries still had life upon recovery. Can you identify the problem?
Q&A: Diagnose This Profile
The data shows conductivity from a 19plus deployed in a shallow estuarine river. The red line shows the CTD downcast and the green line shows the upcast. While the upcast data show the expected shape for a CTD profile (low conductivity at the surface, rising conductivity as the CTD descends), the downcast shows an unusual shape in until about 2.6 meters depth, where conductivity appears to suddenly correct itself.
Q&A: Diagnosing Salinity Spikes
Q&A: Diagnosing Salinity Spikes The figure above shows a time series of salinity from a moored CTD. For most of the deployment, salinity showed frequent downward spikes, dropping from an expected range of 18-26 psu to near zero. Can you determine the cause?...
Ocean Sciences 2020 Conference Posters
Missed us at Ocean Sciences 2020? Check out digital copies of our Science Team’s conference posters to learn more about what they are working on: Field Performance of an ISFET Based Profiling pH SensorCharles W. Branham, Vladislav Simontov, Yuichiro Takeshita &...
Q&A: Two Symptoms of the Same Problem
May 2020 Newsletter The data above show two major symptoms of the same problem occurring in different locations on a 19plusV2 profiling CTD. On the left, oxygen appears to drop below zero and is highly erratic during the downcast (light blue). However, once it hits a...
Tech Tip: Troubleshooting a misfiring bottle
Tech Tip: Troubleshooting a misfiring bottle The SBE 32 and SBE 55 water samplers utilize a unique electromagnetic design to reliably capture water. Did you know that the latches are also dishwasher safe? Watch this video to learn how to remove and clean water sampler...
Q&A: Moored Data Excursions
February 2020 Newsletter The data above came from a HydroCAT-EP multiparameter probe moored in an estuary near Savannah, Georgia. The highlighted section shows a sudden change in the temperature and salinity data that lasted for approximately 4 days, and continued...
Q&A: Negative Fluorescence Data
December 2019 Newsletter Fluorescence is the light emitted by a particle after excitation from another light source. Sea-Bird Scientific fluorometers are widely used to measure fluorescence from chlorophyll as a method of measuring primary productivity. The figure...
Q&A: Erratic Profiles
November 2019 Newsletter The data above come from a profiling CTD, deployed in sea conditions that caused approximately 1-meter ship heave. Two things stick out – relatively unchanging salinity data during the downcast, and noisy data during the upcast (shown in light...
Featured Posts
January 2024 Newsletter
Welcome to the Sea-Bird Swell – our monthly newsletter that gives you the latest in what’s happening at Sea-Bird Scientific, and the broader oceanographic community. CTD Appreciation Day Was January 22nd! HANDS OFF AND HIGH-QUALITY DATA: USING THE HYDROCAT-EP V2 CTD...
Oceanology International 2024
We hope to see you at #Oi24 We are excited to return to Oceanology International 2024 again in London, UK from March 12-14. Overview Oceanology International brings together 500+ exhibitors in the only event that links the three key players in the industry:...
Ocean Sciences Meeting 2024
We hope to see you at #OSM24 We are excited to return to Ocean Sciences Meeting 2024 in New Orleans, Louisiana from February 18-23 at booth number #527. Overview The Ocean Sciences Meeting 2024 is co-sponsored by the American Geophysical Union, the Association for the...