Blog Home » Science and Technology » Data Exercises

Blog Home » Science and Technology » Data Exercises

Data Exercises

Q&A: Unusual Test Bath Data – a Cautionary Tale

Q&A: Unusual Test Bath Data – a Cautionary Tale

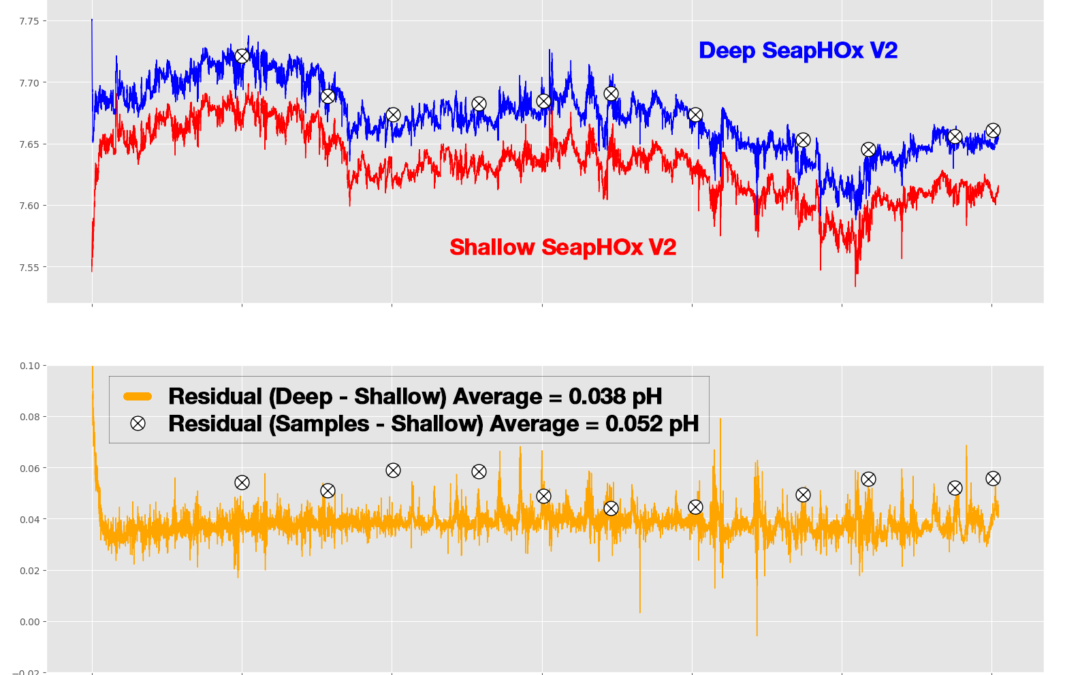
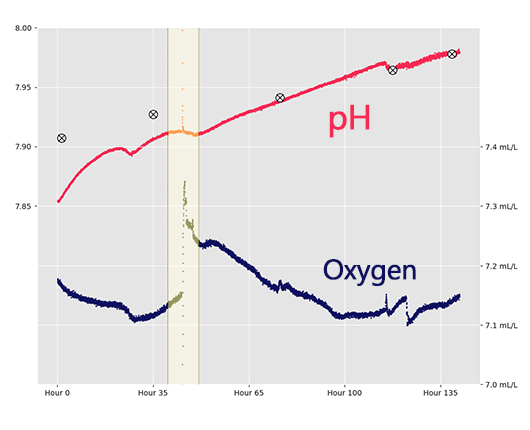
September 2019 Newsletter These data show a small but rather catastrophic deployment error. Shown above, pH and dissolved oxygen data before the highlighted area did not match bottle samples or nearby validation sensors, but data after the highlighted area accurately...

read more
Q&A: High Residuals in pH Data

Q&A: High Residuals in pH Data

March 2019 Newsletter The data shown above come from a SeapHOx V2 (red) and Deep SeapHOx V2 (blue) deployed next to one another in a dynamic estuarine environment. Regular pH validation samples were collected throughout the time-series. According to the 0.05 pH...

read more
Q&A: What is Causing This “Feature” in pH?

Q&A: What is Causing This “Feature” in pH?

The data above originate from a SeaFET pH sensor connected to a flow-through system that should provide stable, consistent data. As you can see, the Internal pH value experiences a dramatic drop in pH and a subsequent increase in noise midway through data collection....

read more
Q&A: Two pH Sensors – what is causing this difference?

Q&A: Two pH Sensors – what is causing this difference?

January 2019 Newsletter The data shown above originate from two different pH sensors deployed in the same well-mixed test bath. Both sensors were cleaned, tested, and calibrated before deployment, and were given 24 hours to equilibrate before recording data. So why...

read more
Q&A: Sudden Increase in Salinity

Q&A: Sudden Increase in Salinity

November 2018 Newsletter The figure above originated from an SBE 37-SMP MicroCAT moored CTD deployed in shallow seawater. On day 38, the salinity data appears to jump from a near-zero value, steadily increasing until around day 43, where it stayed around 30psu. Nearby...

read more
Salinity Spikes: Sensor or Environment?

Salinity Spikes: Sensor or Environment?

These data show a subtle problem that is producing “fuzzy” salinity and oxygen data. While the overall shape of the profile appears reasonable, small spikes are present throughout the CTD cast. The black lines encompass a particularly strange spot where both salinity...

read more

Featured Posts

February 2024 Newsletter

Welcome to the Sea-Bird Swell – our monthly newsletter that gives you the latest on what’s happening at Sea-Bird Scientific and the broader oceanographic community. Introducing Our New Software: Fathom Earlier this month, we released our new SBS Fathom software! Our...

Moored pH Systems

Our Moored pH Systems Ocean pH plays a critical role in the health of the global ocean due to the short timescales relevant to biological activity. With recent studies highlighting the impacts of acidification on the carbon cycle as well as on coral, shellfish,...

Introducing the NEW Fathom Software

Sea-Bird Scientific is thrilled to release the newest innovation in software: Fathom. Fathom: Exploring the depths of your data. Sea-Bird Scientific’s Fathom software makes working with your instruments transparent and simple. View instrument status and diagnostics,...

Secured By miniOrange