Q&A: Identifying Data Types
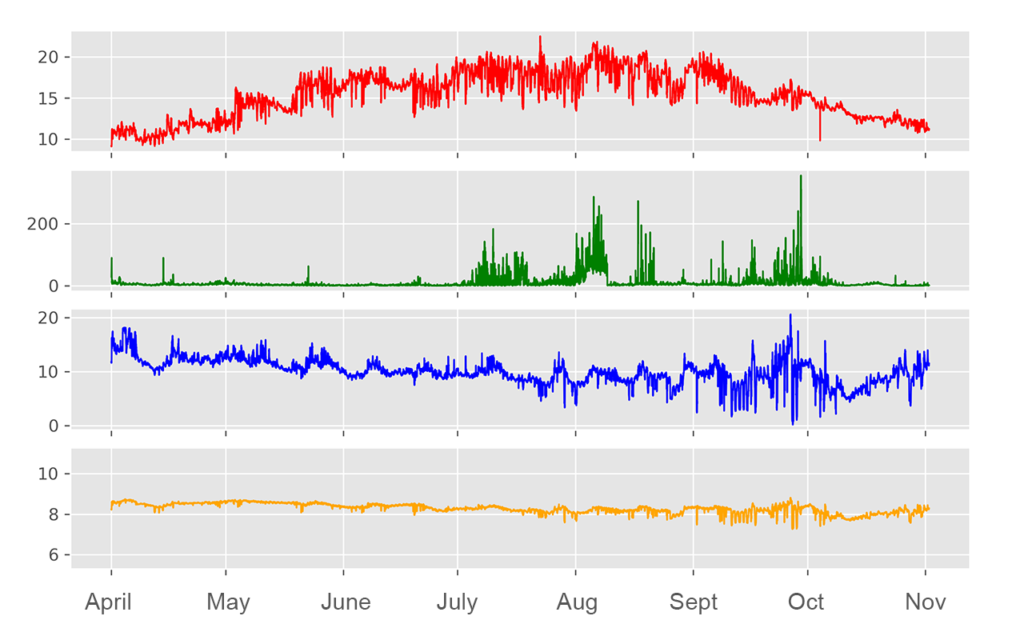
The data above came from a HydroCAT-EP multiparameter CTD in a shallow embayment from April – November. Can you correctly label the 4 plots shown above? The HydroCAT-EP measures the following parameters:
- Temperature
- Conductivity
- Pressure
- Dissolved oxygen
- pH
- Chlorophyll
- Turbidity
Hint: this area is subject to periods of eutrophication during the late summer/early fall.
Find the Answer
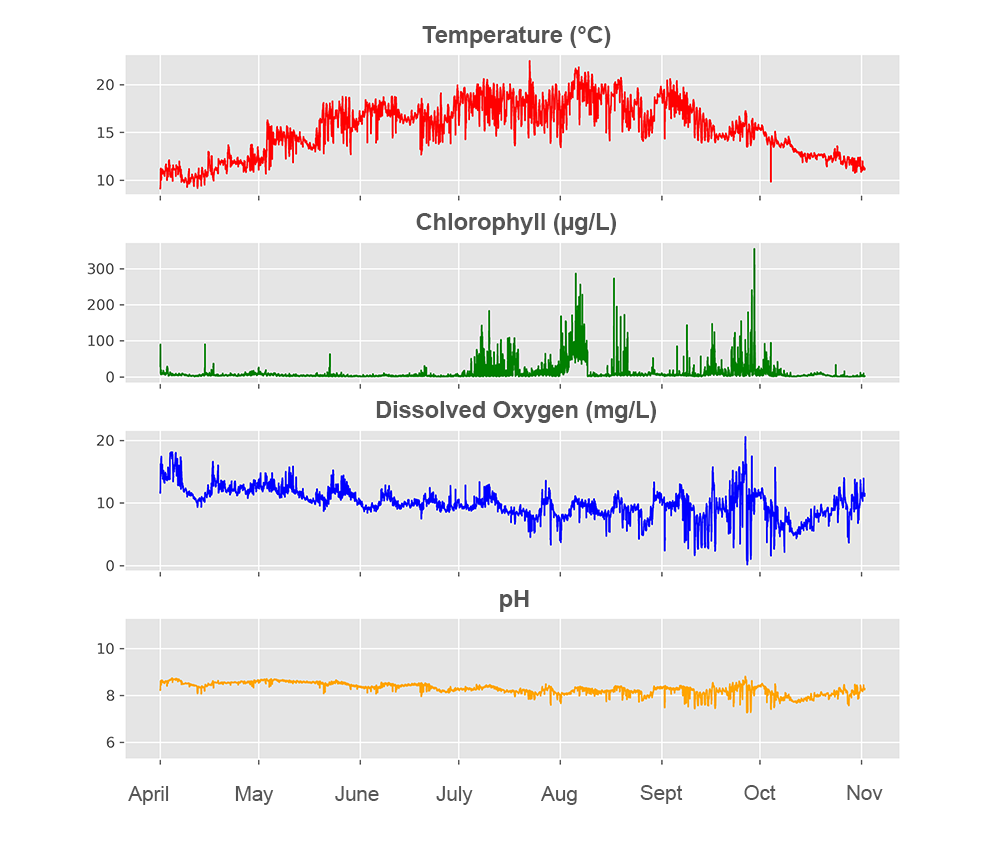
From top to bottom, the plots contain:
- Temperature (°C)
- Chlorophyll (µg/L)
- Dissolved Oxygen (mg/L)
- pH
Chlorophyll and dissolved oxygen are monitored closely at this site, as nitrate loading from a nearby harbor contributes to low dissolved oxygen conditions. Multiparameter instruments like the HydroCAT-EP help to catch these events and tie each parameter into a broader context.
Related Posts

Featured Posts
UG2 Workshop 2024
We hope to see you at UG2 '24 We are excited to sponsor the upcoming 2024 Glider Workshop in Ann Arbor, Michigan, from September 10 - 12, 2024. Overview This workshop will bring together the global underwater glider community to strengthen international collaboration...
Oceanology International 2024
We hope to see you at #Oi24 We are excited to return to Oceanology International 2024 again in London, UK from March 12-14. Overview Oceanology International brings together 500+ exhibitors in the only event that links the three key players in the industry:...
Ocean Sciences Meeting 2024
We hope to see you at #OSM24 We are excited to return to Ocean Sciences Meeting 2024 in New Orleans, Louisiana from February 18-23 at booth number #527. Overview The Ocean Sciences Meeting 2024 is co-sponsored by the American Geophysical Union, the Association for the...
Science and Technology
Platform