Blog Home » Platform » Shipboard

Blog Home » Platform » Shipboard

Shipboard

History of the SeaCAT

History of the SeaCAT

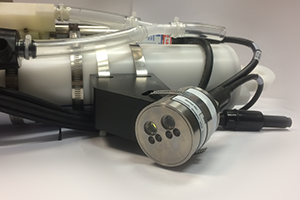
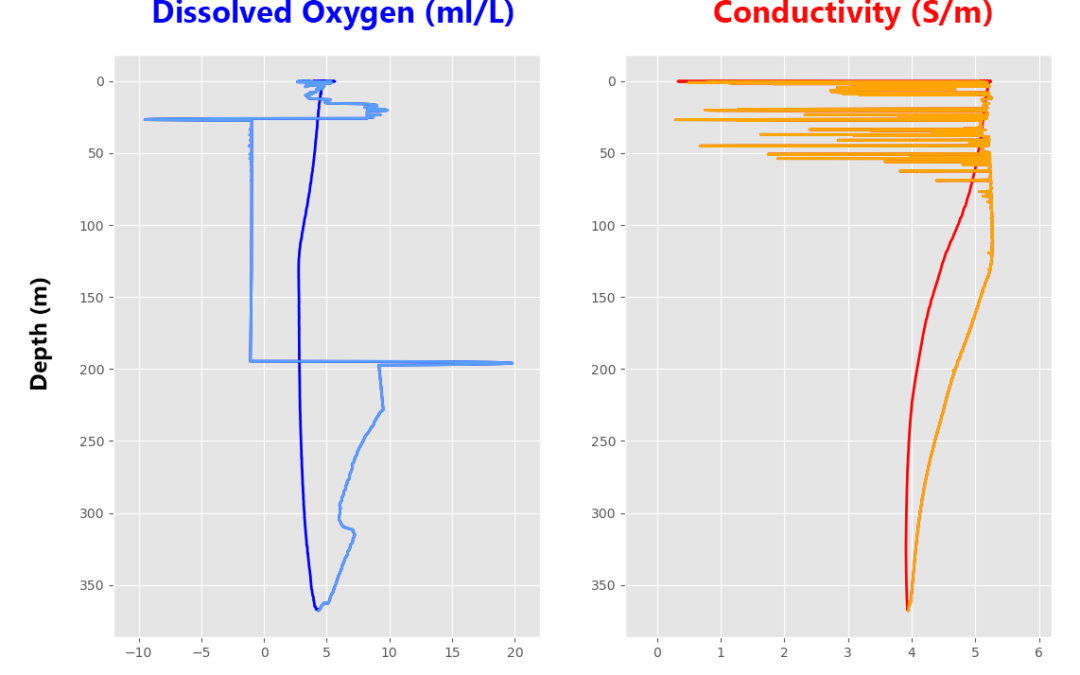
SeaCATs, the CTD family consisting of the 16plus V2 and 19plus V2, were first developed in late 1985 back when Sea-Bird had barely evolved past a garage operation. When a customer requested a moored CTD – the first that Sea-Bird had ever built, Sea-Bird's team...

read more
CTDs as Data Loggers

CTDs as Data Loggers

The acronym “CTD” might unofficially represent more than just conductivity, temperature, and depth. Since most CTDs include one or more auxiliary sensors, a given CTD package might technically be called a “CTDpHDOFLNTUTr” (CTD + pH + dissolved oxygen + fluorescence +...

read more
Q&A: Regular Spikes in Salinity

Q&A: Regular Spikes in Salinity

This salinity profile was from an arctic deployment in rough seas. At a certain point, we see regular salinity spikes of about ± .01 psu in the upcast data. Can you determine what caused this?

read more
BGC Sensors that Power Argo

BGC Sensors that Power Argo

Did you know that the sensors that power BGC-Argo are also in heavy use on shipboard and moored platforms? Learn about the analogous BGC sensors for deployment on moorings and vessels, and how your field crew can keep stride with ocean robots.

read more
Analog Sensor Integration Guide

Analog Sensor Integration Guide

From bottom contact triggers to transmissometers, oceanographic sensor options are vast and diverse, and choosing the right combination of sensors can significantly augment a CTD’s measurement capabilities. Although getting disparate technologies to talk to one...

read more
RS-232 Sensor Integration Guide

RS-232 Sensor Integration Guide

Unlike analog auxiliary sensors, instruments that output serial RS-232 data are more challenging to integrate with Sea-Bird Scientific CTDs. Despite RS-232 being a standard communication protocol, most instruments have a unique data output format and command set. As...

read more
Q&A: Temperature Mismatch

Q&A: Temperature Mismatch

Although they should match perfectly, the two sensors rarely reported the same temperature value throughout their deployment. Furthermore, the 16plusV2 appeared to stop logging, although the batteries still had life upon recovery. Can you identify the problem?

read more
Q&A: Diagnose This Profile

Q&A: Diagnose This Profile

The data shows conductivity from a 19plus deployed in a shallow estuarine river. The red line shows the CTD downcast and the green line shows the upcast. While the upcast data show the expected shape for a CTD profile (low conductivity at the surface, rising conductivity as the CTD descends), the downcast shows an unusual shape in until about 2.6 meters depth, where conductivity appears to suddenly correct itself.

read more
Q&A: Two Symptoms of the Same Problem

Q&A: Two Symptoms of the Same Problem

May 2020 Newsletter The data above show two major symptoms of the same problem occurring in different locations on a 19plusV2 profiling CTD. On the left, oxygen appears to drop below zero and is highly erratic during the downcast (light blue). However, once it hits a...

read more

Featured Posts

2024 MTS Buoy Workshop

We are excited to exhibit at the upcoming MTS Buoy Workshop this year from May 20 - 23. Please come visit us in our backyard at table #1 to chat with our team to learn more about the latest at Sea-Bird Scientific and oceanography. We'll have associates from...

Secured By miniOrange