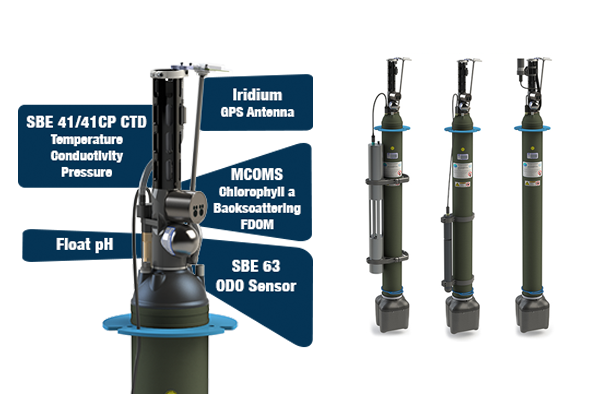
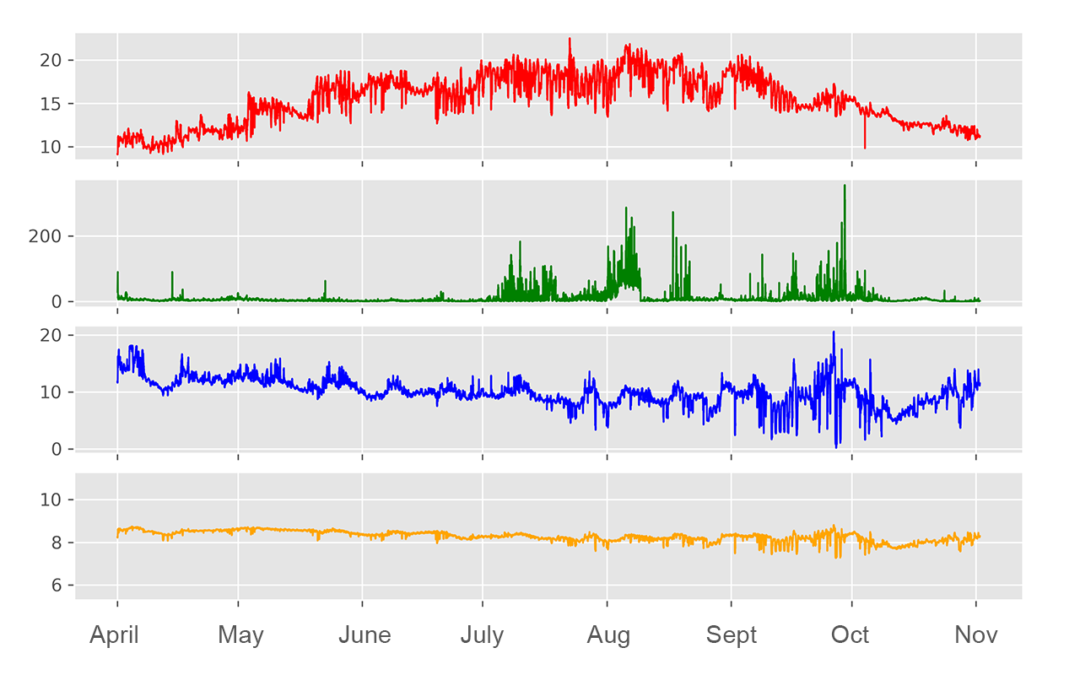
The HydroCAT-EP V2 is the next generation of multiparameter instruments. It measures CTD data alongside dissolved oxygen, pH, fluorescence, and turbidity, all within a single self-contained package. Learn about the new changes to this product.
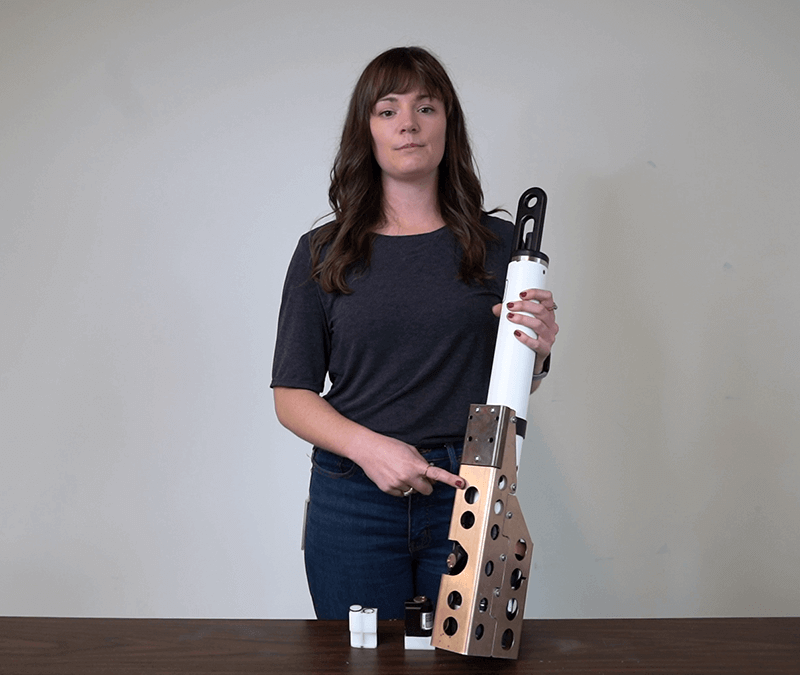
Oceanographic Sampling
CTDs as Data Loggers
The acronym “CTD” might unofficially represent more than just conductivity, temperature, and depth. Since most CTDs include one or more auxiliary sensors, a given CTD package might technically be called a “CTDpHDOFLNTUTr” (CTD + pH + dissolved oxygen + fluorescence +...
The Argo Program in Numbers
In the last year of news, the dominant story has been a science topic: the coronavirus pandemic. And though most forms of Marine Science have little to do with the global response to COVID-19, its effects are felt in almost every aspect of our own scientific...
What is the STS Sensor?
You never know what’s floating on the surface. That’s why Sea-Bird created the STS – to prevent the main Argo CTD from ingesting surface contaminants, but still obtain surface data. Learn how it helps extend deployments.
BGC Sensors that Power Argo
Did you know that the sensors that power BGC-Argo are also in heavy use on shipboard and moored platforms? Learn about the analogous BGC sensors for deployment on moorings and vessels, and how your field crew can keep stride with ocean robots.
History of the Argo CTD
Believe it or not, the first profiling floats couldn’t measure temperature and salinity. They solely traced ocean currents, totally ignorant of the sweet CTD data they were passing by. Adding a CTD changed the game. Learn more about the early beginnings of Argo, and how Sea-Bird’s first float CTD helped change the face of oceanography.
5 Inductive Modem Configurations
Inductive modem moorings are capable and flexible. Learn how 1 mooring line can facilitate real-time data for up to 100 instruments, in 5 unique configurations.
Inductive Modem Telemetry
IM systems eliminate the need for connectors entirely, transforming a mooring’s tether into a medium for real-time data transmission.
Q&A: Measurements Along the Tidal Cycle
Zooming in shows salinity and dissolved oxygen are fluctuating heavily alongside the tidal cycle. Can you determine what is causing this?
Q&A: Identifying Data Types
Can you correctly label the 4 plots? Hint: this area is subject to periods of eutrophication during the late summer/early fall.
Featured Posts
2024 MTS Buoy Workshop
We are excited to exhibit at the upcoming MTS Buoy Workshop this year from May 20 - 23. Please come visit us in our backyard at table #1 to chat with our team to learn more about the latest at Sea-Bird Scientific and oceanography. We'll have associates from...
Case Study: Understanding the Implications of the Lahaina Wildfire on Coastal Water Quality with the HydroCAT-EP V2
Contributors: Dr. Andrea Kealoha (she/her)¹, Natalie Zielinski (she/her)², Marialena Christopoulou (she/her)² Authors: Lindsey Biondo (she/her)², Natalie Zielinski (she/her)² ¹ University of Hawai’i at Mānoa, Department of Oceanography, 1000 Pope Road, Honolulu, HI...
Webinar on Fathom Software in Partnership with the Marine Technology Society
We were excited to partner with the Marine Technology Society (MTS https://www.mtsociety.org/) to bring you a webinar to walk through our new software. We’re excited to release Fathom – the latest in software innovation at Sea-Bird Scientific (SBS). Heather Eberhart,...