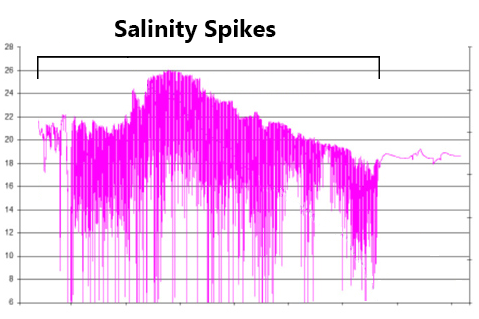
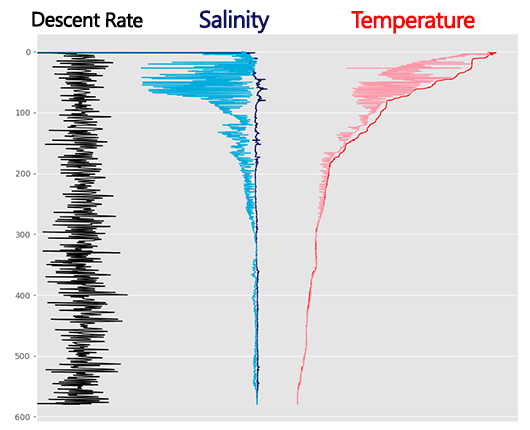
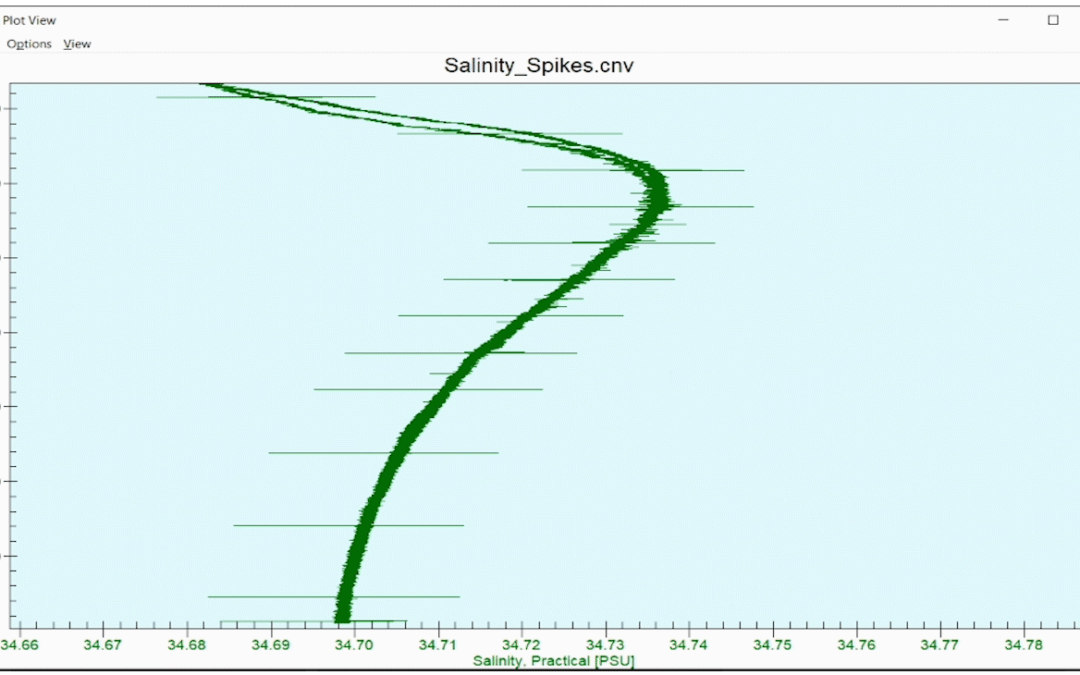
This salinity profile was from an arctic deployment in rough seas. At a certain point, we see regular salinity spikes of about ± .01 psu in the upcast data. Can you determine what caused this?
Q&A: Regular Spikes in Salinity
read more