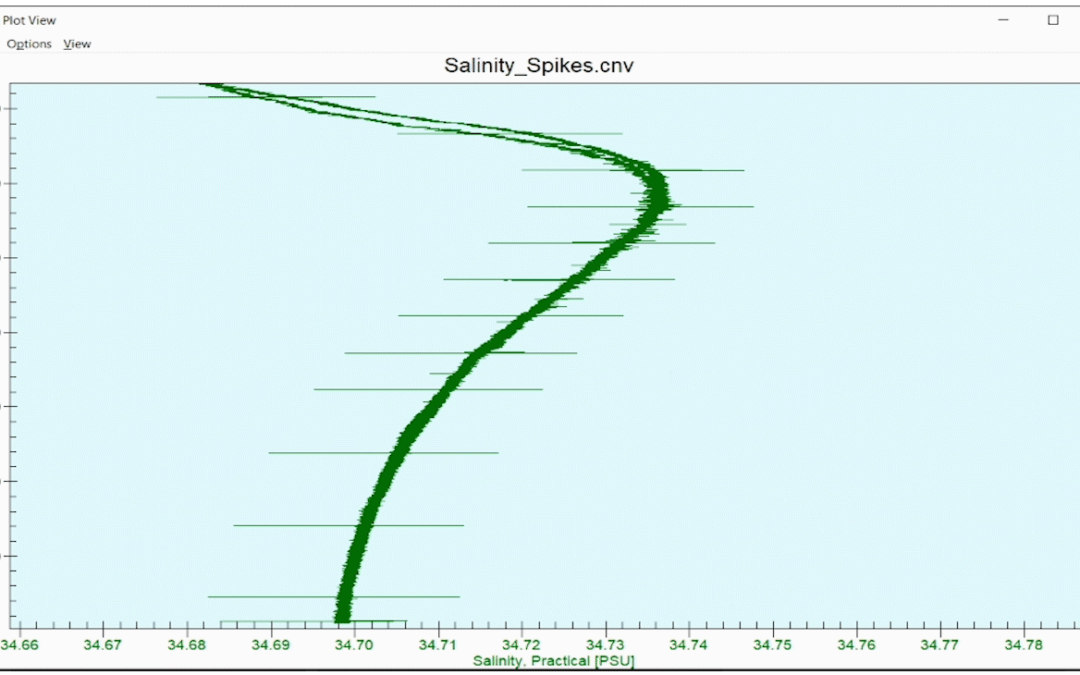
This salinity profile was from an arctic deployment in rough seas. At a certain point, we see regular salinity spikes of about ± .01 psu in the upcast data. Can you determine what caused this?


This salinity profile was from an arctic deployment in rough seas. At a certain point, we see regular salinity spikes of about ± .01 psu in the upcast data. Can you determine what caused this?

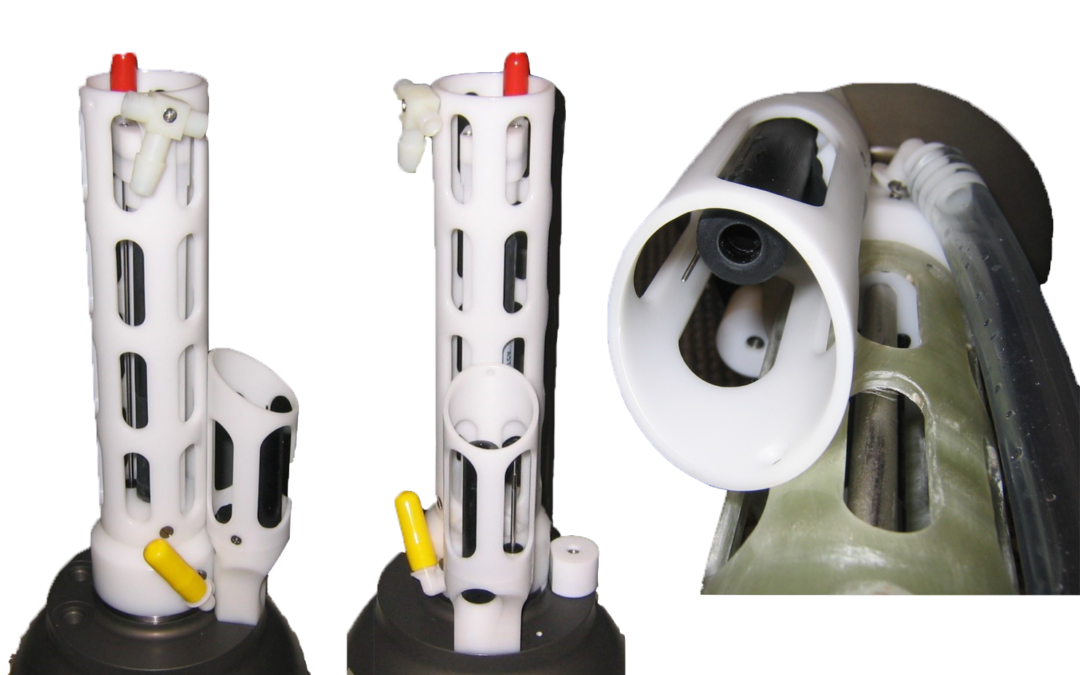
You never know what’s floating on the surface. That’s why Sea-Bird created the STS – to prevent the main Argo CTD from ingesting surface contaminants, but still obtain surface data. Learn how it helps extend deployments.

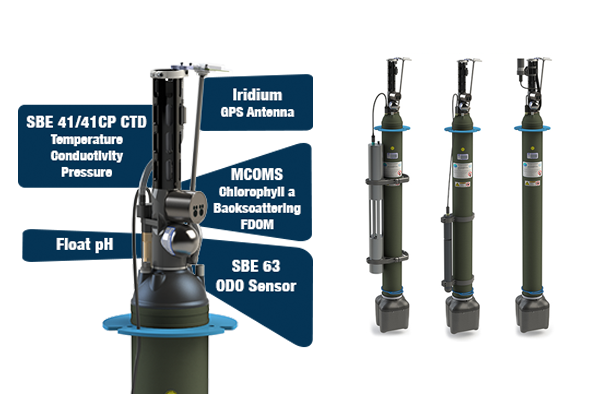
Did you know that the sensors that power BGC-Argo are also in heavy use on shipboard and moored platforms? Learn about the analogous BGC sensors for deployment on moorings and vessels, and how your field crew can keep stride with ocean robots.

Believe it or not, the first profiling floats couldn’t measure temperature and salinity. They solely traced ocean currents, totally ignorant of the sweet CTD data they were passing by. Adding a CTD changed the game. Learn more about the early beginnings of Argo, and how Sea-Bird’s first float CTD helped change the face of oceanography.
Press Release FOR IMMEDIATE RELEASE Sea-Bird Scientific Announces New Distribution Agreement with TERAMARA (formerly DASCO Equipment Inc.) Bellevue, WA – August 1st, 2024 – Sea-Bird Scientific, a leading provider of oceanographic and environmental monitoring...
We hope to see you at our upcoming Scripps Technical Forum We invite members of the Scripps community to join us for an in-person Technical Forum and visit at the Scripps campus on October 16 + 17 in La Jolla, San Diego, CA, to showcase the latest in software...
We hope to see you at Ocean Optics Conference XXVI 2024 Please join us for our exhibition at the Ocean Optics Conference XXVI in Las Palmas De Gran Canaria, Spain, from October 6-11, 2024. Overview The Ocean Optics Conference attracts a diverse audience of active...