Zooming in shows salinity and dissolved oxygen are fluctuating heavily alongside the tidal cycle. Can you determine what is causing this?
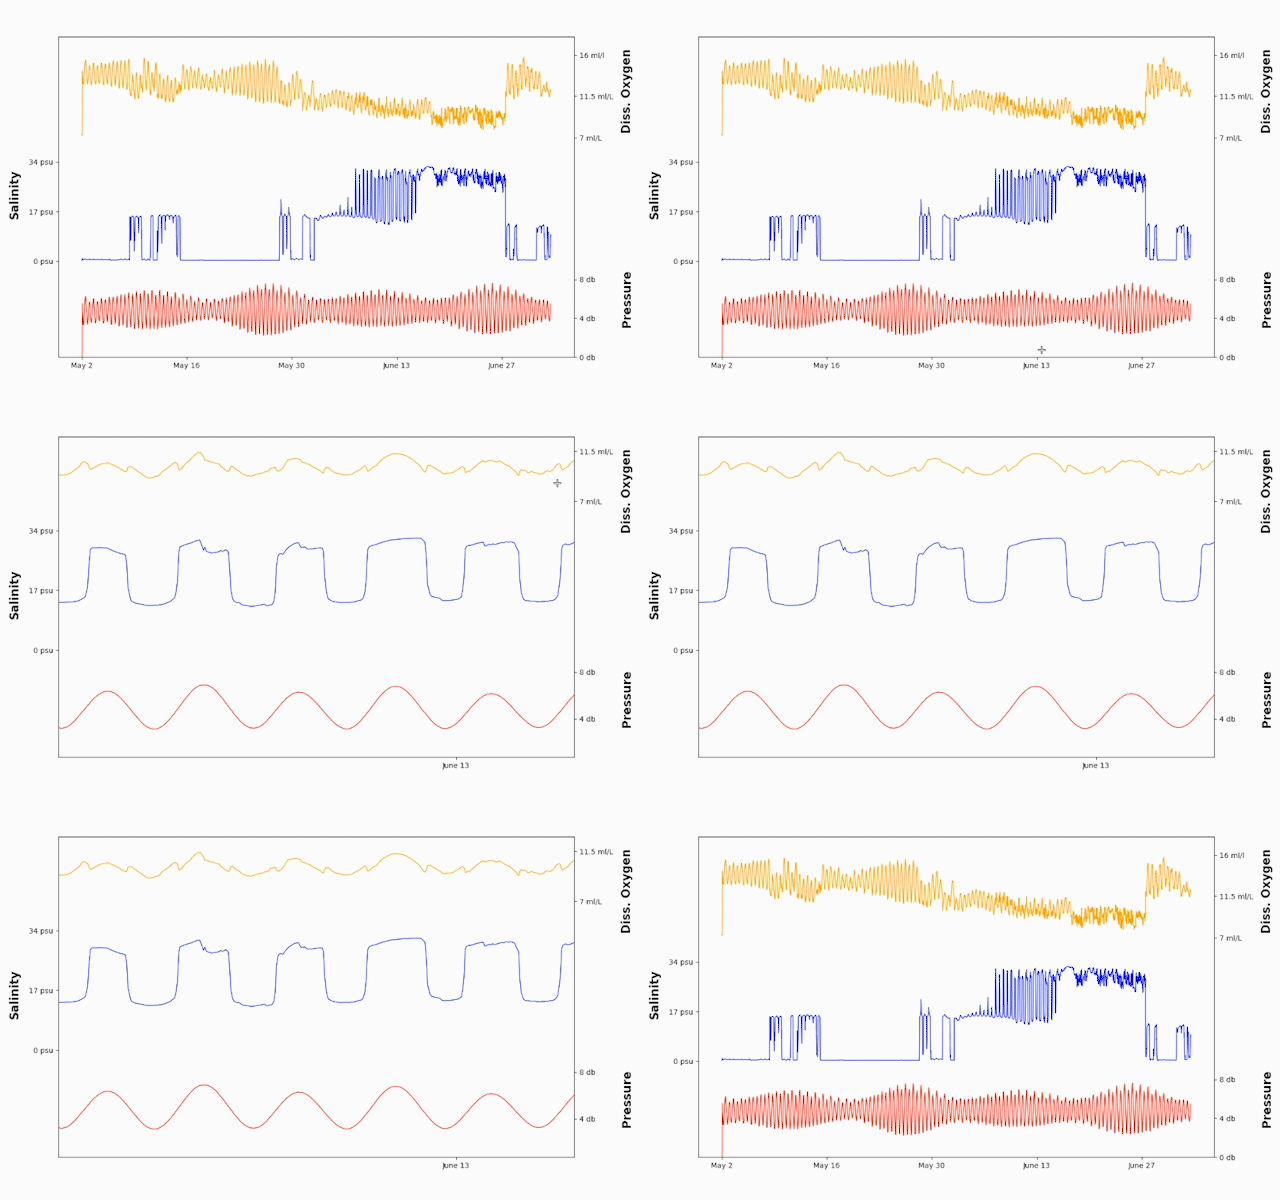

Zooming in shows salinity and dissolved oxygen are fluctuating heavily alongside the tidal cycle. Can you determine what is causing this?
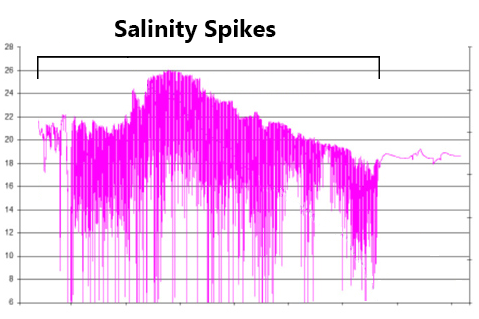
Q&A: Diagnosing Salinity Spikes The figure above shows a time series of salinity from a moored CTD. For most of the deployment, salinity showed frequent downward spikes, dropping from an expected range of 18-26 psu to near zero. Can you determine the cause?...
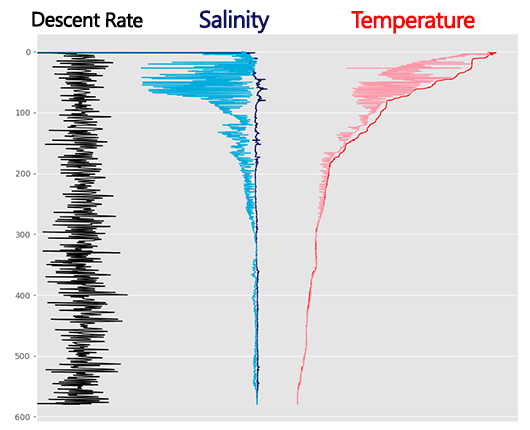
November 2019 Newsletter The data above come from a profiling CTD, deployed in sea conditions that caused approximately 1-meter ship heave. Two things stick out – relatively unchanging salinity data during the downcast, and noisy data during the upcast (shown in light...
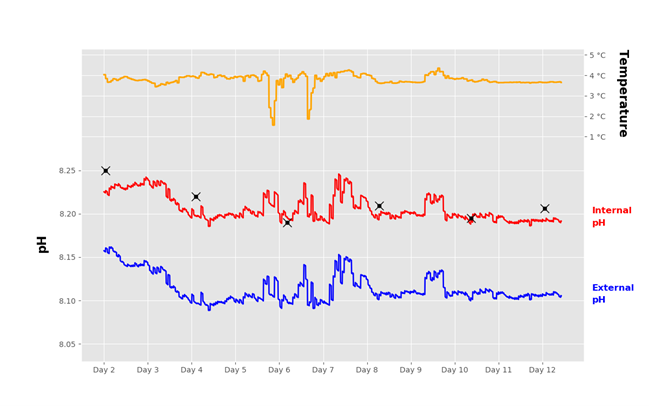
The figure above originates from a single Shallow SeaFET V2 pH sensor, which produces two pH values (Internal pH and External pH) from two separate reference sensors. The black X’s indicate pH validation samples. While environmental conditions affect each the...
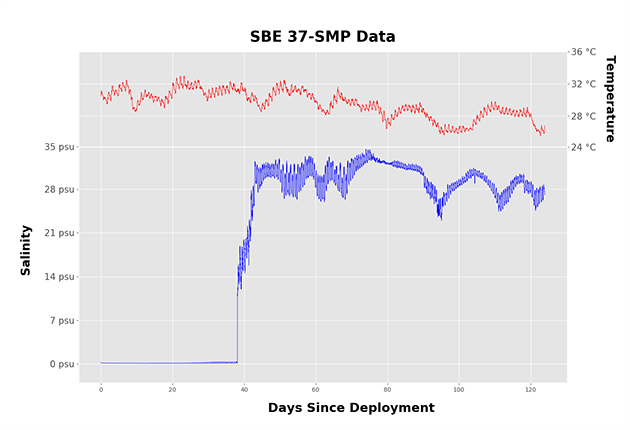
November 2018 Newsletter The figure above originated from an SBE 37-SMP MicroCAT moored CTD deployed in shallow seawater. On day 38, the salinity data appears to jump from a near-zero value, steadily increasing until around day 43, where it stayed around 30psu. Nearby...
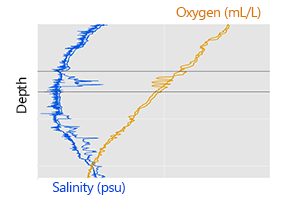
These data show a subtle problem that is producing “fuzzy” salinity and oxygen data. While the overall shape of the profile appears reasonable, small spikes are present throughout the CTD cast. The black lines encompass a particularly strange spot where both salinity...
The Deep SeapHOx™ V2: Revolutionizing Moored Ocean Monitoring Welcome to the future of oceanographic research with the Deep SeapHOx™ V2. Designed for long-term deployments in diverse environments, from shallow regions to the deep ocean, this state-of-the-art...
The HydroCAT-EP V2 Multiparameter CTD: Precision Insights for Environmental Monitoring Dive into the future of environmental monitoring with Sea-Bird Scientific's cutting-edge HydroCAT-EP V2 (HCEP-V2). This multiparameter CTD offers an impressive dynamic range,...
We hope to see you at AGU24 Overview Each year, AGU’s annual meeting, the largest gathering of Earth and space scientists, convenes 25,000+ attendees from 100+ countries to share research and connect with friends and colleagues. Scientists, educators, policymakers,...