Q&A: Temperature Mismatch
January 2021 Newsletter
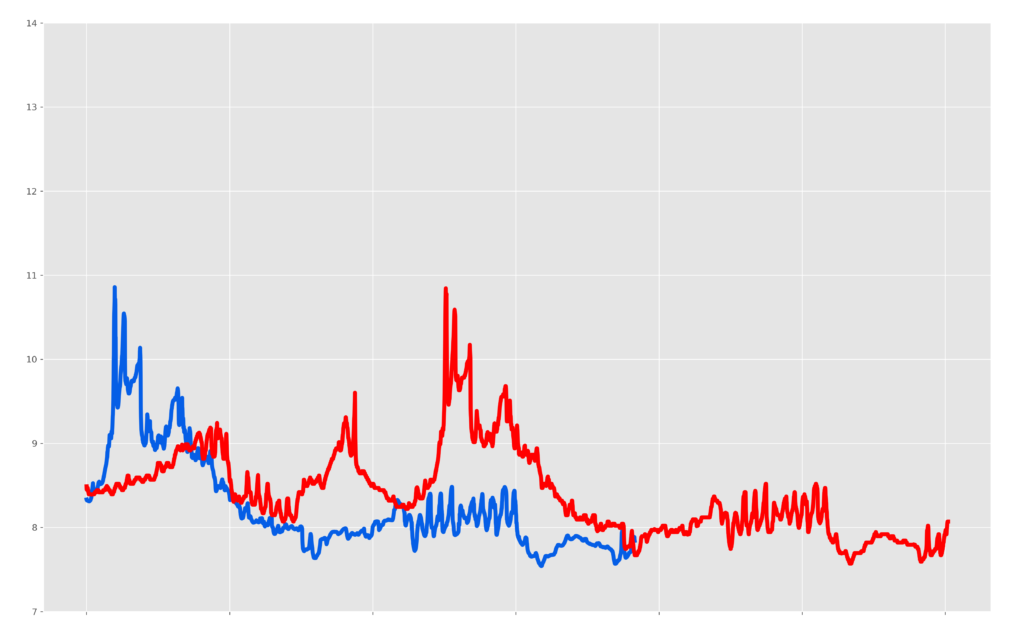
The data above show temperature collected from two different moored instruments. The data in blue come from a 16plusV2 SeaCAT CTD, while the data in red come from another temperature sensor deployed next to the SeaCAT on the seafloor. Although they should match perfectly, the two sensors rarely reported the same temperature value throughout their deployment. Furthermore, the 16plusV2 appeared to stop logging, although the batteries still had life upon recovery. Can you identify the problem?
Hint: this problem is a prime example of the benefits of data visualization for troubleshooting.
Find the Answer
Can’t see the animated gif? Click Here.
Both instruments were logging accurate data that matched the other almost exactly – due to a simple mistake, the 16plusV2 SeaCAT simply started logging AFTER the other sensor. In this case, it was because the clock on the 16plusV2 was set incorrectly. A post-recovery breakdown shows the sequence of events leading up to this error:
- The date/time on the 16plusV2 was programmed incorrectly in the lab, set to approximately 3 months later than the actual date.
- The 16plusV2 was programmed to start logging at a delayed start time that matched the date/time of the deployment (with the commands “startdatetime=mmddyyyyhhmmss” and “startlater”).
- Both sensors were physically deployed on the seafloor very close to one another. The SeaCAT was still waiting to begin logging (although the operator believed that it had started logging per the delayed programming), while the other sensor was manually configured to begin logging moments before the deployment.
- After 3 months, the incorrect clock on the SeaCAT met the delayed start date/time, and began logging.
- Plotting the data post-recovery by date offset the data between the two sensors in the resulting figure.
At first glance, it appeared that there were significant mismatches in temperature between the two sensors. Fortunately, visualizing the data showed a noteworthy peak in temperature towards the middle of the deployment. Since this unique shape was present in both datasets, we were able to match the shape in both sensors’ temperature time-series to determine that the SeaCAT began logging later than expected. Checking the clock after this analysis verified that it was indeed set incorrectly.
Related Posts


Featured Posts
UG2 Workshop 2024
We hope to see you at UG2 '24 We are excited to sponsor the upcoming 2024 Glider Workshop in Ann Arbor, Michigan, from September 10 - 12, 2024. Overview This workshop will bring together the global underwater glider community to strengthen international collaboration...
Oceanology International 2024
We hope to see you at #Oi24 We are excited to return to Oceanology International 2024 again in London, UK from March 12-14. Overview Oceanology International brings together 500+ exhibitors in the only event that links the three key players in the industry:...
Ocean Sciences Meeting 2024
We hope to see you at #OSM24 We are excited to return to Ocean Sciences Meeting 2024 in New Orleans, Louisiana from February 18-23 at booth number #527. Overview The Ocean Sciences Meeting 2024 is co-sponsored by the American Geophysical Union, the Association for the...
Science and Technology
Platform