The new HydroCAT-EP V2 provides some useful upgrades and tools. learn how to use and process data from our latest multiparameter instrument.
Sea-Bird University Session Recording: The New HydroCAT-EP V2
read more
The new HydroCAT-EP V2 provides some useful upgrades and tools. learn how to use and process data from our latest multiparameter instrument.
Multiparameter instruments can help us better understand natural events. Learn more from our presentation to the Scripps Technical Forum.
Learn how to request service and calibration in our world class facilities in Bellevue, WA, Philomath, OR, and Kempten Germany.
Sea-Bird Scientific will be attending the OCEANS 2022 Conference in Chennia, India, from Feb 21-24!
We’re excited to announce Sea-Bird Scientific is attending the Aquasur Conference this year from March 2-4, 2022. Visit us at Booth B299b!
Join us for a special Sea-Bird University session covering how to use, maintain, and process data from this new HydroCAT-EP V2. Classes are held virtually and registration and attendance are 100% free. January 26th, 300:pm PST.
We’re excited to announce Sea-Bird Scientific is virtually exhibiting at the Ocean Sciences Conference this year from February 27 to March 4.
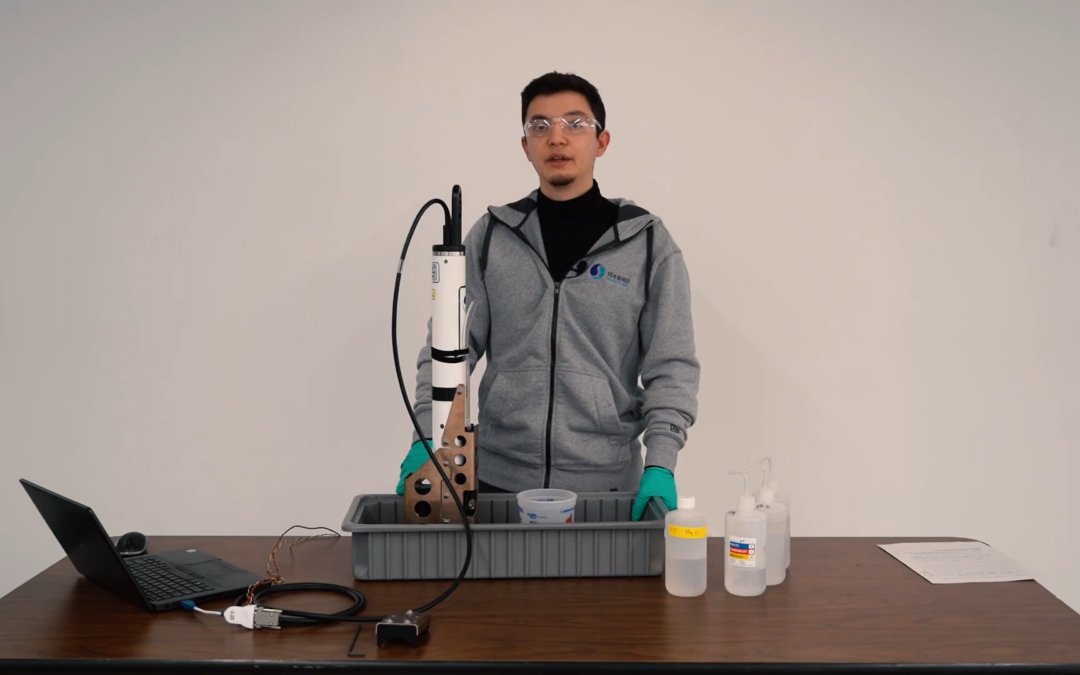
Grab some pH buffer solutions and follow Cody Littleton, our primary HydroCAT-EP Service Technician, as he walks you through how to calibrate this pH sensor.
We’re excited to announce Sea-Bird Scientific is virtually exhibiting at the Ocean Sciences Conference this year from February 27 to March 4.
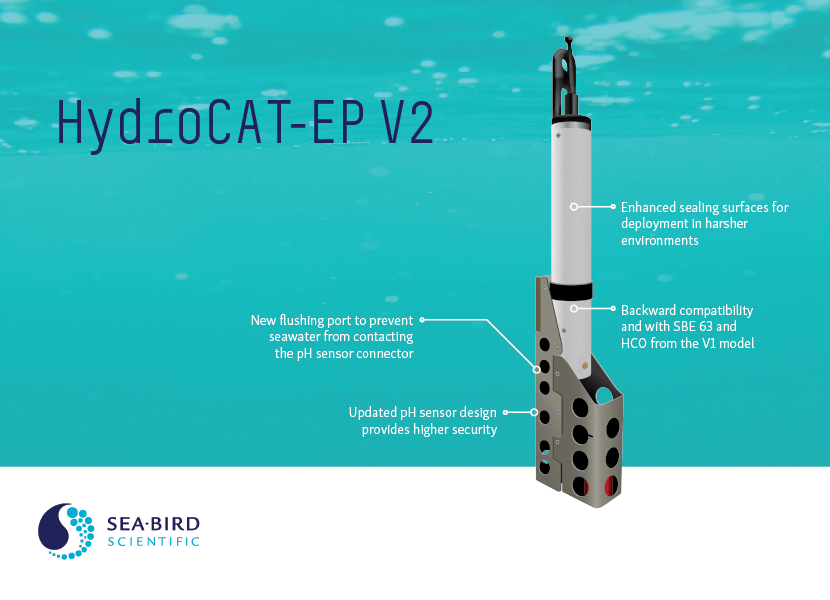
The new HydroCAT-EP V2 includes some useful changes. Current owners of the HydroCAT-EP V1 are eligible for a free or low cost upgrade, depending on your instrument’s purchase date.
We hope to see you at UG2 '24 We are excited to sponsor the upcoming 2024 Glider Workshop in Ann Arbor, Michigan, from September 10 - 12, 2024. Overview This workshop will bring together the global underwater glider community to strengthen international collaboration...
Press Release Wednesday, June 26 2024 Collaboration and partnership is at the core of what we do. We are - Enabling the science that matters - working with scientists and researchers across the globe to provide instrumentation that produces defensible and accurate...
Celebrating and honoring our LGBTQIA+ communities It is in our DNA at Sea-Bird Scientific to embrace community and the beauty in diversity. As during previous Pride Months, we have changed our logo on social media to feature the colors of Pride throughout the month of...